


Visibility Went Up. Lead Calls Went Down. Here’s Why That’s Actually a Win.
When we ran a GBP optimization test for an HVAC client in January 2026, the first number everyone noticed was the drop in lead calls: 227 down to 133.
If that’s where the analysis stops, you’re looking at a failure. Fewer calls, fewer jobs booked. But stopping there means missing what actually changed.
The Number That Changes the Story
We looked at the 4 weeks before and after implementation and saw that lead calls decreased from 227 to 133.
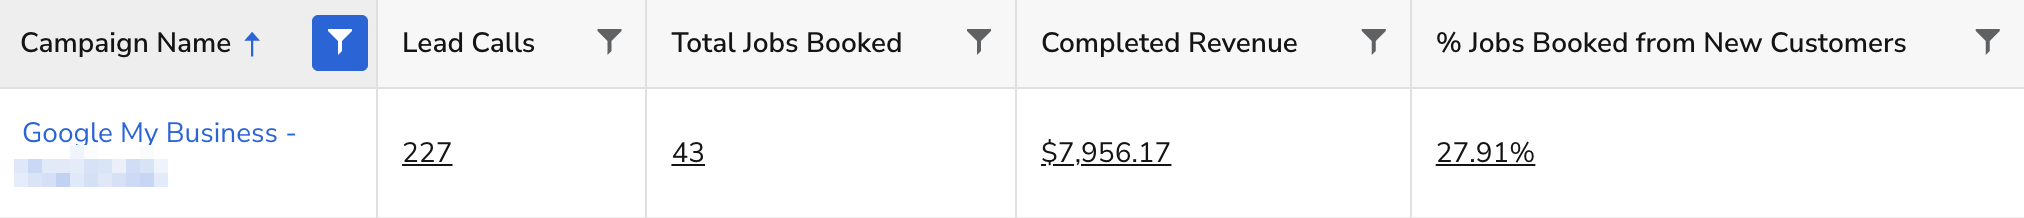
When you look more closely at the numbers, you see that of the 227 lead calls, 43 jobs were booked, and only $8,763.17 in completed revenue, with 27.91% of those jobs coming from new customers.
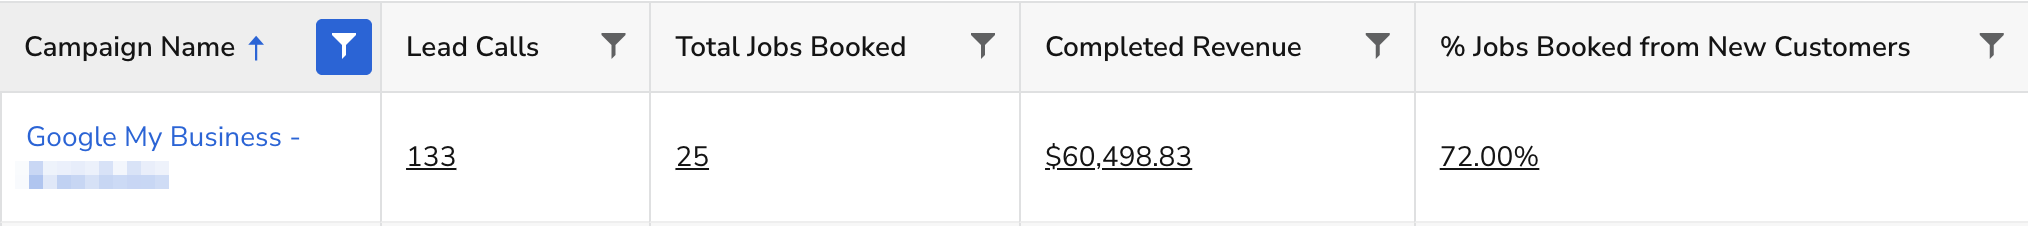
After the optimization, we saw 133 lead calls, with 25 jobs booked, and $61,020.69 in completed revenue, where 72% of jobs booked were from new customers.
Roughly half the call volume produced more than seven times the revenue, and the majority of those calls were from people who had never contacted this business before.
The post-optimization callers weren’t just more valuable individually. They represented a fundamentally different audience: people actively searching for a service they needed right now, finding this listing, and converting. The listing was finally reaching the right people.
This shows the same time period last year, so you can see a YoY comparison of this data:

There were 161 calls in the previous year, with 49 booked, $11k in completed revenue, and only 28.57% of jobs booked from new customers. Again, showing that after the category change, the visibility led to new users booking services from this GBP.
Why Basic Data Lies to You
This result would have been reported as a failure without call tracking in place. Most local businesses and many agencies are still measuring GBP performance by call volume alone, and it’s easy to understand why. It’s the most visible metric: calls go up, things are working; calls go down, something is broken. But volume without attribution context is noise dressed up as a signal.
Call tracking gives you the layer underneath: who called, whether they were a new or existing customer, whether they converted, and what the completed revenue looked like (if that call tracking data is synced with their CRM). Without it, a client sees 227 going to 133 and panics. With it, you see $8,763 going to $61,020 and understand what actually happened.
GBP optimization not only affects how many people find you, but also who finds you. A listing that pulls in repeat customers by habit will produce high call volume with low new-customer acquisition. A listing optimized for active search intent will pull in net-new demand, and those callers convert differently because they’re in the market right now. Volume metrics can’t capture that shift, and it’s not a gap you can close with a better spreadsheet. It requires call tracking that ties calls back to source, customer type, and outcome.
If you can’t measure who’s calling, you can’t measure what your optimization actually did.
What We Changed and Why
After an analysis of the client’s GBP, we decided to do the following:
- Primary category update: The primary category was a shoulder category based on what the client was looking to get more business with at that time. We updated it to “Heating Contractor” to align with peak season demand. This single change tells Google what this business is most relevant for right now, and it directly affects which searches trigger the listing in the map pack.
- Service additions: We identified services that competitors in the map pack were surfacing that weren’t reflected in the client’s listing.
- Product expansion: We added new products related to the category change. These are high-intent service categories that searchers use to find providers, and they weren’t represented in the listing at all before the test.
What the Rankings Showed
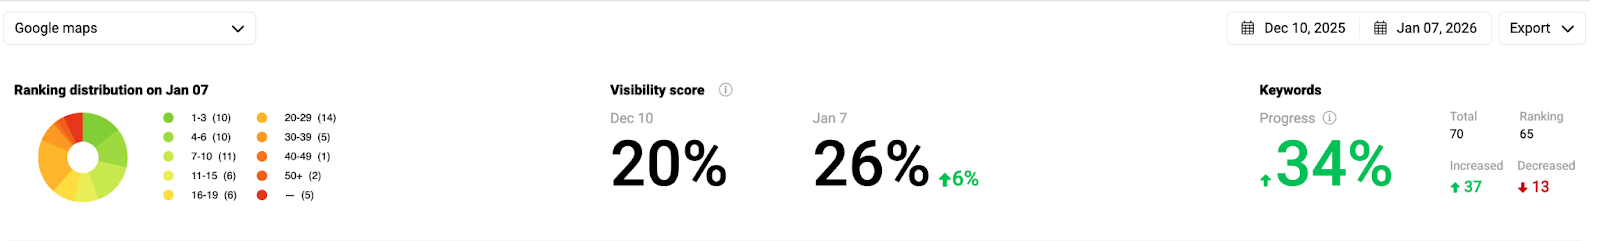
The ranking data backed up the business impact. We filtered for heater-related keywords and saw the visibility score increase from 20% to 26%, and keyword progress increase 34% overall, with 37 keywords improving and 13 declining. On January 7, the ranking distribution showed 10 keywords in positions 1-3, 10 in positions 4-6, and 11 in positions 7-10.
More importantly, a significant number of keywords that had been sitting on page 2 and beyond moved onto page 1. The terms that gained the most ground were heating-related: boiler installation, furnace installation, and heat pump services across the client’s service area. These weren’t keywords the listing was competitive for before the category and product changes.
After the update, they started showing up in positions that generate real visibility because the listing was now telling Google what this business actually does in winter.
What This Means for How You Manage GBP
A few things worth building into your process.
- Audit category alignment seasonally. The primary category isn’t a set-it-and-forget-it decision, especially for service businesses with seasonal demand. An HVAC company optimized for AC repair in January is leaving heating searches on the table. Review it at least quarterly.
- Run a competitive service and product gap analysis. Before assuming a listing is complete, pull the top 3 map pack competitors and compare their services and products against yours. Look for gaps.
- Set up call tracking before you run any tests: If you don’t have attribution in place before you make changes, you lose the ability to measure what those changes actually did. If results look counterintuitive on the surface, you’ll have no data to explain them or defend the work.
- Report on lead quality alongside lead volume: A client who only sees call volume will misread results like this every time. Build the habit of showing source, new vs. existing customer breakdown, and completed revenue alongside the call count.
The Basics Aren’t Basic
Foundational GBP work gets underestimated because it doesn’t sound impressive.
Updating a category, adding services, expanding a product list: none of that makes for a compelling pitch deck slide. But a handful of targeted listing updates, grounded in competitive analysis, produced a 7x increase in revenue during this test period. The ranking movement was real. The audience shift was real. The business impact was measurable.
None of it would have been visible without proper call tracking in place. Call volume is a starting point, not a conclusion. The full story requires attribution, and the optimization work that moves the needle most is often the work that looks the least glamorous on paper. Document your tests, track your attribution, and don’t let raw numbers make the call for you.
Want to see how SEO testing can move the needle?
Schedule a discovery call with RicketyRoo
to start testing smarter and making data-backed SEO decisions.