

The buyer’s journey has multiple touchpoints (TikTok, YouTube, AI-powered search, etc) before someone ever reaches the website, but most SEO reports still treat social media like it belongs to a different department.
That’s a problem, because social content directly influences some metrics SEOs are measured on: branded search volume, on-site engagement, and now — visibility in AI-generated answers. If you’re not tracking what’s happening on social media alongside your search data, you’re missing half the story.
I’ll walk you through a Looker Studio report template I built that brings social and search data together in a single view designed specifically for SEOs. I’ll explain which metrics matter, which ones don’t, why everything in this report is correlative rather than causal, and how to read it to actually make better decisions.
Why SEOs Need to Look at Social Data
This is not a social media report. It’s a search report that includes social signals.
The distinction matters. A social media manager cares about follower growth, content calendars, and engagement rates in isolation. An SEO cares about whether social activity is driving demand that shows up in search: branded impressions, direct traffic, referral sessions, and, eventually, conversions.
The connection between social content and search behavior is real, but it’s directional, not definitive. When a company posts a TikTok that gets 67 likes and 1,200 views, we can’t draw a straight line from that video to a branded search three days later. What we can do is look at patterns over time: Are months with more social activity also months with higher branded impressions? When a video goes semi-viral, does the branded search line move?
These are correlation questions, and they’re the right questions to ask. You don’t need to prove causation to make better strategic decisions. You just need enough signal to know whether the effort is directionally working.
Social Content Is Showing Up in AI Search — And SEOs Need to Pay Attention
Here’s something that makes this report even more relevant right now: social media content is surfacing in AI-powered search results.
If you’ve been paying attention to how LLMs compile their answers, you’ve probably noticed something: They’re pulling from TikTok videos, YouTube content, Reddit threads, and other social platforms as source material. That’s a fundamental shift in how visibility works, and it has direct implications for how we think about social content as SEOs.
Think about what this means for a local business. When someone asks ChatGPT “what should I look for in a roofing contractor?” or types a conversational query into Google that triggers an AI Overview, the answer isn’t just pulling from blog posts and service pages. It’s pulling from the ecosystem of content that exists about that topic, including short-form video, user discussions, and social proof.
Like SEOs, social media managers don’t have an exact way to measure profile or content views that came in from ChatGPT or other LLMs. For TikTok, you can view Traffic Sources in Analytics and see “Other” and in YouTube Studio, “External sites or apps.”
At this point, SEOs need to consider how social content can affect the overall search journey. Your clients’ posts aren’t only building brand awareness in the traditional sense, but they can potentially become source material for conversational search experiences. Looking at what’s performing well can help inform the website’s content strategy so everything works together. (E.g., placing these videos on the site, creating a GBP post using social content, expanding a video series into a blog series, etc.)
The Report Structure: What’s In It and Why
The template is a 5-page Looker Studio report that pulls from three data sources: Google Search Console, Google Analytics 4, and Metricool (which connects social media data). Here’s what each page does and why it exists.
Page 1: The Cross-Channel Cover Page
This is the executive summary. It answers one question: Are social and search working together?
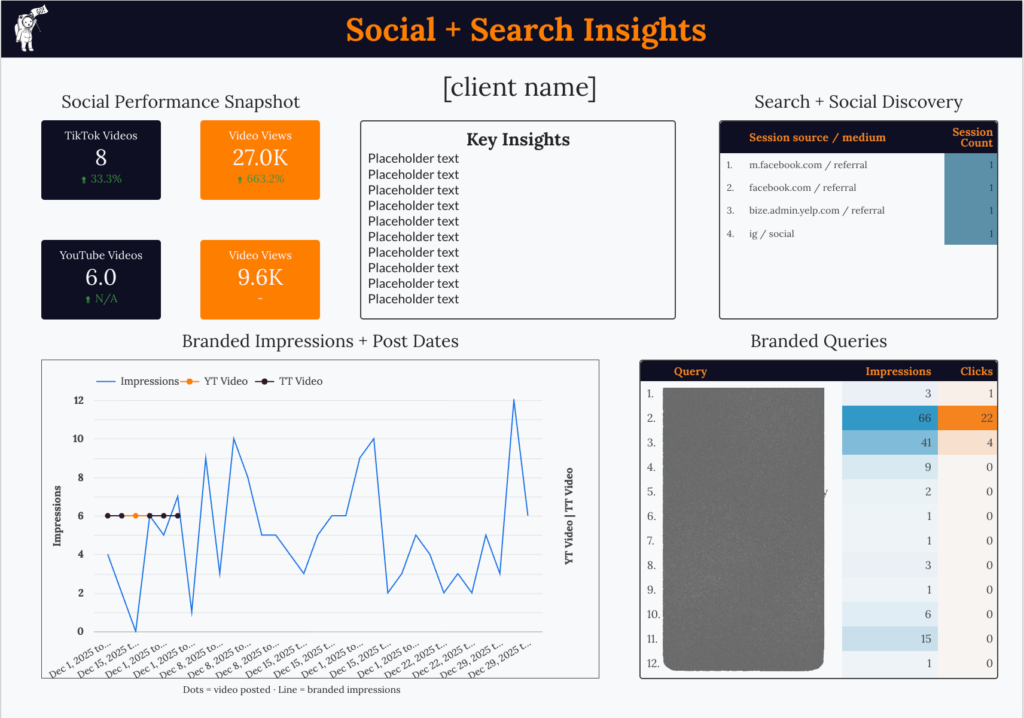
The cover includes:
- Social Performance Snapshot
- TikTok and YouTube KPIs side by side: videos posted and video views for each platform, with month-over-month comparison. These are “input” metrics that show effort level.
- A blended chart showing video post dates overlaid with branded search impressions.
- This chart doesn’t prove that posting a video causes branded search to increase. But it lets you visually scan for patterns: Do impression spikes follow posting clusters? Does a quiet week on social also show a dip in brand searches?
- Branded Queries table
- Pulled directly from GSC, filtered to brand terms. Shows impressions and clicks for each branded variation. This tells you whether brand awareness is growing and which brand name variants people are actually searching for.
- GA4 Social Referrals
- Shows which social platforms are sending traffic to the site and through which medium (referral vs. social). This answers a basic but important question: Is social content driving any measurable site traffic?
- Key Insights box
- A manual text field updated monthly. This is where you write 3–5 observations connecting the social and search data.
Page 2: TikTok Deep Dive
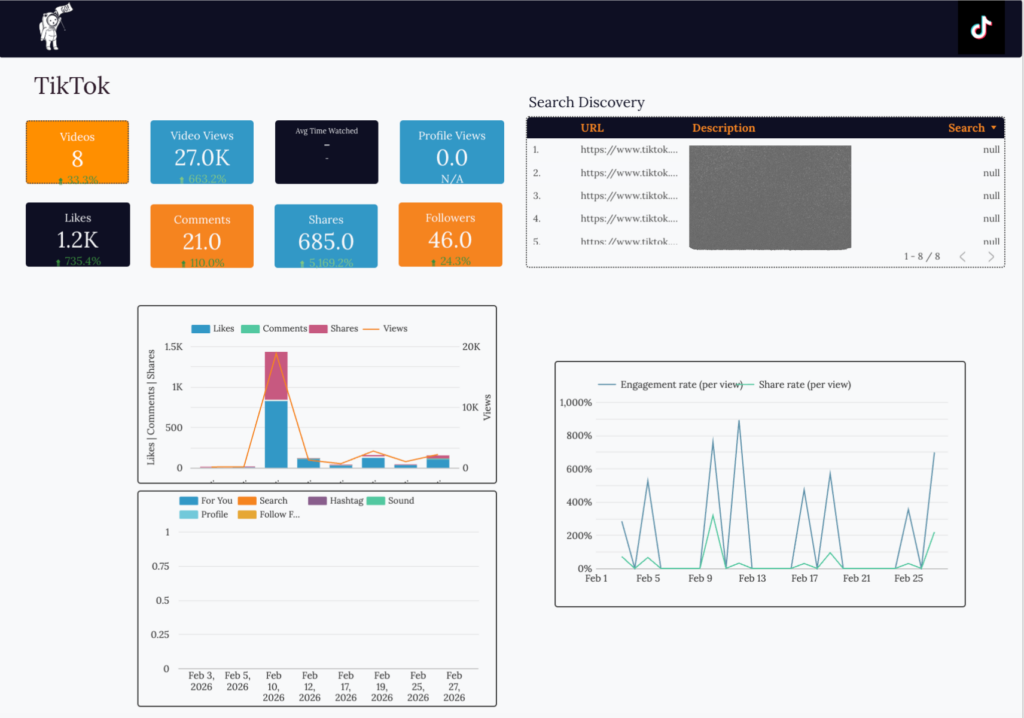
This page is for the SEO who wants to understand what’s actually happening on TikTok beyond the headline numbers.
The KPIs here are: Videos posted, Video Views, Likes, Comments, Shares, and Followers (all with month-over-month comparison).
The view-source breakdown chart is where this page becomes interesting for SEOs. Metricool tracks where TikTok views came from: For You feed, Search, Hashtags, Profile, Sound, and Follow. The Search source is the most relevant for SEO because it means people are actively searching on TikTok and finding this content.
The Search Discovery table shows each video’s URL, its description, and the number of views from TikTok Search. This is the most directly useful chart on this page for SEOs, because it answers a question we couldn’t easily answer before: which specific pieces of content are people actively searching for and finding on TikTok? Monitoring this over time can reveal which topics have search demand on the platform, which can inform your keyword research and website content strategy.
The engagement + views combo chart shows likes, comments, and shares as stacked bars with a views line overlay. This lets you see at a glance whether engagement scaled with views or fell behind.
Why Engagement Rate and Share Rate Matter
Here’s the formula for each:
Engagement rate (per view): (SUM(Interactions) / SUM(Views)) * 100
Share rate (per view): (SUM(Shares) / SUM(Views)) * 100
Engagement rate and share rate tell you whether the content resonated with the people who saw it. And content that resonates is content that creates brand memory, the kind that leads someone to Google your business name later.
Here’s how to read the relationship between views and rates:
- Views up, rates flat or down: “Distribution spike.” The algorithm pushed the content to more people, but it didn’t stick. This might mean the hook was good enough to not get scrolled past (so TikTok kept serving it), but the content itself didn’t make people feel anything. From an SEO perspective, this type of spike is less likely to produce branded search lift because the content didn’t create brand memory.
- Views up, rates up: “True winner.” This is the signal you want. More people saw the content AND a higher proportion of those people engaged with it. This combination means the content genuinely resonated, and it’s your strongest indicator that brand demand may follow. When you see this pattern, look at what the video was about and how it was made. Those content themes are worth doubling down on and worth reflecting in your website content strategy.
- Rates up, views flat: “Strong creative, limited distribution.” The content resonated with the people who saw it, but TikTok didn’t push it widely. From an SEO perspective, the topics in these videos are still worth mining for website content ideas because the engagement proves people care about them.
- Views flat, rates flat: “Steady state.” Nothing broke, nothing popped. This is your baseline.
None of these relationships are causal. A “true winner” TikTok doesn’t guarantee that branded search will increase. But if you track these patterns month over month alongside your GSC branded impression data, you start building an evidence base for whether social content is contributing to brand demand, and that’s exactly the kind of directional intelligence that helps SEOs make better resource allocation decisions.
Page 3: TikTok Video Rankings
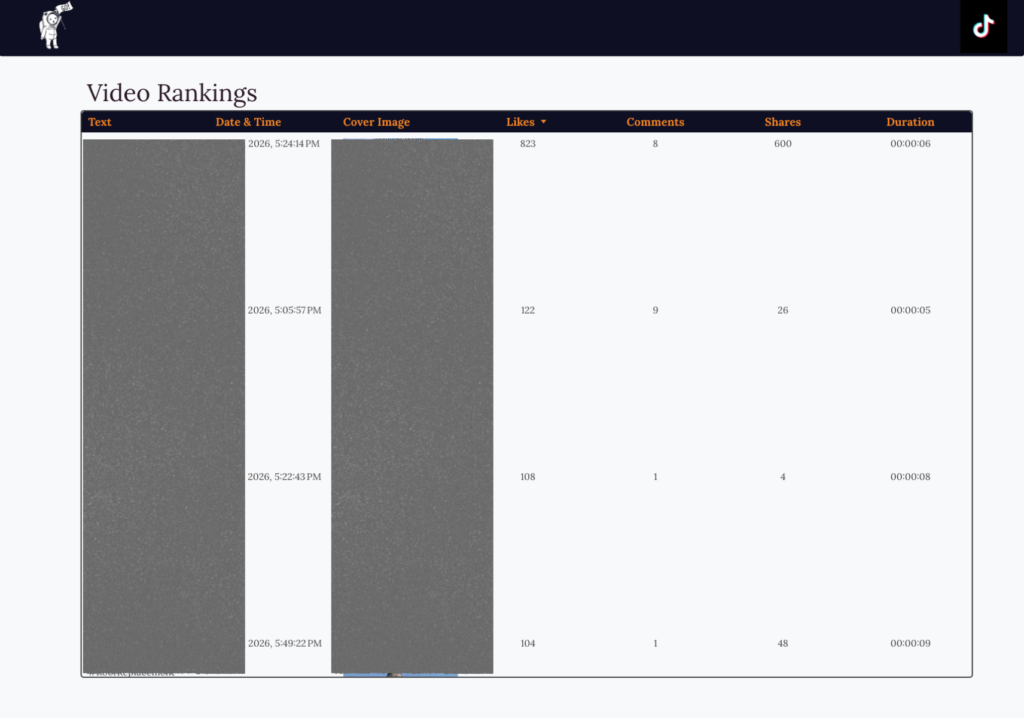
This page shows every video posted in the reporting period, sorted by likes. It includes the video text, post date, cover image, likes, comments, shares, and duration.
For an SEO, the value here is content theme analysis. Look at the top-performing videos and ask: What topics, formats, and angles are working? Are the “day in the life” videos outperforming the testimonial videos? Are short clips (5–7 seconds) getting more engagement than longer ones?
You can use that insight to inform website copy, FAQ content, service page messaging, and even Google Business Profile posts. And in the context of AI search, the content themes that resonate most on social are likely the same themes that conversational search tools will prioritize when pulling together answers because engagement signals indicate topical relevance and value.
Pages 4 & 5: YouTube Overview and Video Rankings
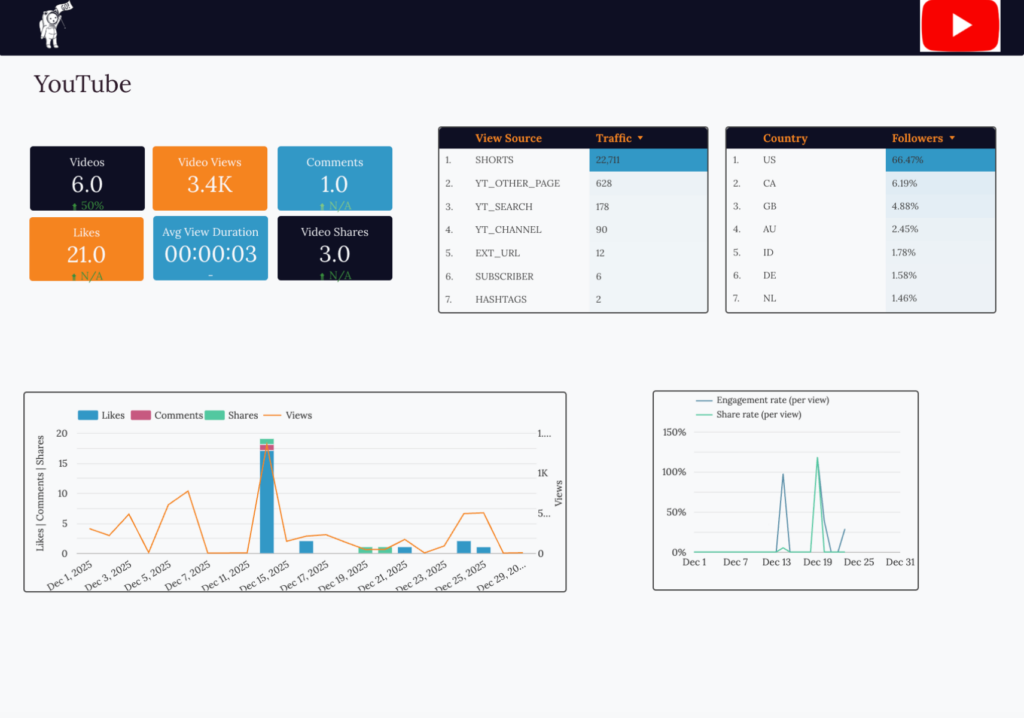
The YouTube pages mirror the TikTok structure but with YouTube-specific data. The overview page includes KPIs (videos, views, likes, comments, avg view duration, shares), a view source breakdown (Shorts, YT Search, Hashtags, Channel, Other Page), a country distribution table, and the engagement/share rate chart.
Two YouTube-specific data points are particularly useful for SEOs:
- YT_SEARCH traffic source tells you how many views came from people searching within YouTube. Like TikTok Search views, this is a direct search intent signal.
- Average view duration tells you whether people are actually watching the content. A video with 1,000 views but a 3-second average view duration is essentially being skipped. A video with 260 views and a 9-second average duration is actually being consumed. For SEOs who embed YouTube videos on website pages, this metric predicts whether the embed will improve or hurt on-page engagement metrics.
The Video Rankings page (page 5) shows all videos sorted by views, with the full metrics breakdown. Same principle as TikTok: use this to identify which content themes perform, then carry those insights into your search strategy.
(Note: If you’re wondering why there isn’t a per-video search traffic table on the YouTube pages like there is for TikTok, I tried. The Metricool connector stores YouTube video URLs and YouTube traffic source data in completely separate tables with no shared fields to join on.)
What This Report Doesn’t Do (and Why That’s Okay)
This report is intentionally incomplete as a social media report. It doesn’t track:
- Follower demographics beyond country
- Optimal posting times
- Hashtag performance analysis
- Competitor social benchmarking
- Content calendar adherence
- Story or carousel performance
- Social media ad performance
None of these are relevant to an SEO’s job; this report exists at the intersection of social and search.
The metrics in this report are also directional, not prescriptive. When branded impressions increase after a cluster of TikTok posts, the report doesn’t tell you “TikTok caused this.” It shows you a pattern and lets you form a hypothesis. The report gives you the data to run those experiments and evaluate the outcomes.
How to Use This Report Monthly
Here’s the workflow I recommend:
- Before writing insights, look at the blended chart first. Scan for any obvious correlation between posting dates and impression movement. Note it even if you’re not sure it’s meaningful; patterns become clearer over multiple months.
- Check the engagement rate and share rate trends. Are they moving in the same direction as views, or diverging? Flag any “true winners” (views up + rates up) or “distribution spikes” (views up + rates flat/down).
- Review the top-performing videos. What themes do they have in common? What language do they use? This is qualitative data that informs content research and strategy in ways that traditional SEO tools can’t.
- Cross-reference with branded queries. Are any new branded variations appearing? Do they relate to social content themes?
- Check TikTok and YouTube search view sources. What’s being searched for? If you can, check TikTok’s “Others searched for” suggestions for the brand name.
- Think about AI search implications. Which content themes are generating the most engagement and search-source views? What story does it tell about your client’s brand? This is the kind of forward-thinking analysis that separates reactive SEO from proactive strategy.
- Write the insights. Connect the dots between social performance and search behavior. Be honest about what you see and what you don’t. “No correlation observed between posting frequency and branded impressions this month” is a perfectly valid insight, and it tells the team that the current social strategy may not be impacting search, and that’s useful information.
Getting Started
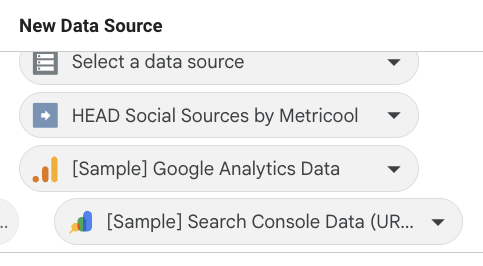
The report template uses three data sources: Google Search Console (connected directly in Looker Studio), Google Analytics 4 (connected directly), and Metricool as the social data connector for TikTok and YouTube.
Metricool connects to Looker Studio through their official Looker Studio connector (listed as “HEAD Social Sources by Metricool”). You’ll need a Metricool account with your TikTok and YouTube profiles connected. The connector pulls all the TikTok Evolution, TikTok Videos, Youtube Evolution, and Youtube Published in range Videos fields used throughout this report.
Make a copy of the template and connect your data sources to get started.
The Future of Search Reporting Is Cross-Channel
Search behavior is fragmenting, and it’s fragmenting faster than most of our reporting frameworks can keep up with. People use TikTok as a search engine. They watch YouTube Shorts before calling for a quote. And increasingly, they’re asking AI-powered tools conversational questions that pull answers from across the entire content ecosystem, including social platforms.
These platforms feed the AI search layer, which is rapidly becoming the first touchpoint for a growing number of queries. Social content that generates real engagement isn’t just about building brand awareness in the traditional sense. It’s building the topical footprint that AI systems reference when someone asks “best banana pudding matcha made with house-made syrups” or “what should I look for in an exterior contractor?”
As SEOs, we can either ignore that reality and keep reporting in isolation, or we can build reporting frameworks that reflect how people actually discover and evaluate businesses today. This report is one way to do that. It’s not perfect, it’s not comprehensive, and the connections it surfaces are correlative, not causal. But it puts the data in front of you in a way that prompts better questions, informs better content strategy, and helps you make the case for why SEO and social need to work together — not as separate departments with separate reports, but as complementary channels serving the same goal: getting found by the right people at the right time, on whatever platform they happen to be using.
The template is free to use. Connect your own data sources, adapt the layout to your clients, and start paying attention to the space between social and search. That’s where the most interesting insights are hiding, and it’s exactly where AI search is looking too.