Location Pages: What Crosses the Line to Doorway Abuse & Spammy Content? June 30th, 2025 By Marco Silva You’ve heard it a hundred times: build a location page for every city, town, or locale you serve. And for… READ MORE →
A Content Creator’s Guide to Ethical Boundaries June 25th, 2025 By Melissa Popp Every content creator, whether freelancer, agency, strategist, or in-house pro, eventually runs face-first into the same wall: a client request… READ MORE →
Celeste Gonzalez Named Microsoft Clarity Ambassador June 2nd, 2025 By Celeste Gonzalez We’re thrilled to share some exciting news from the RooKrew: Celeste Gonzalez, Director of RooLabs, has officially been named a… READ MORE →
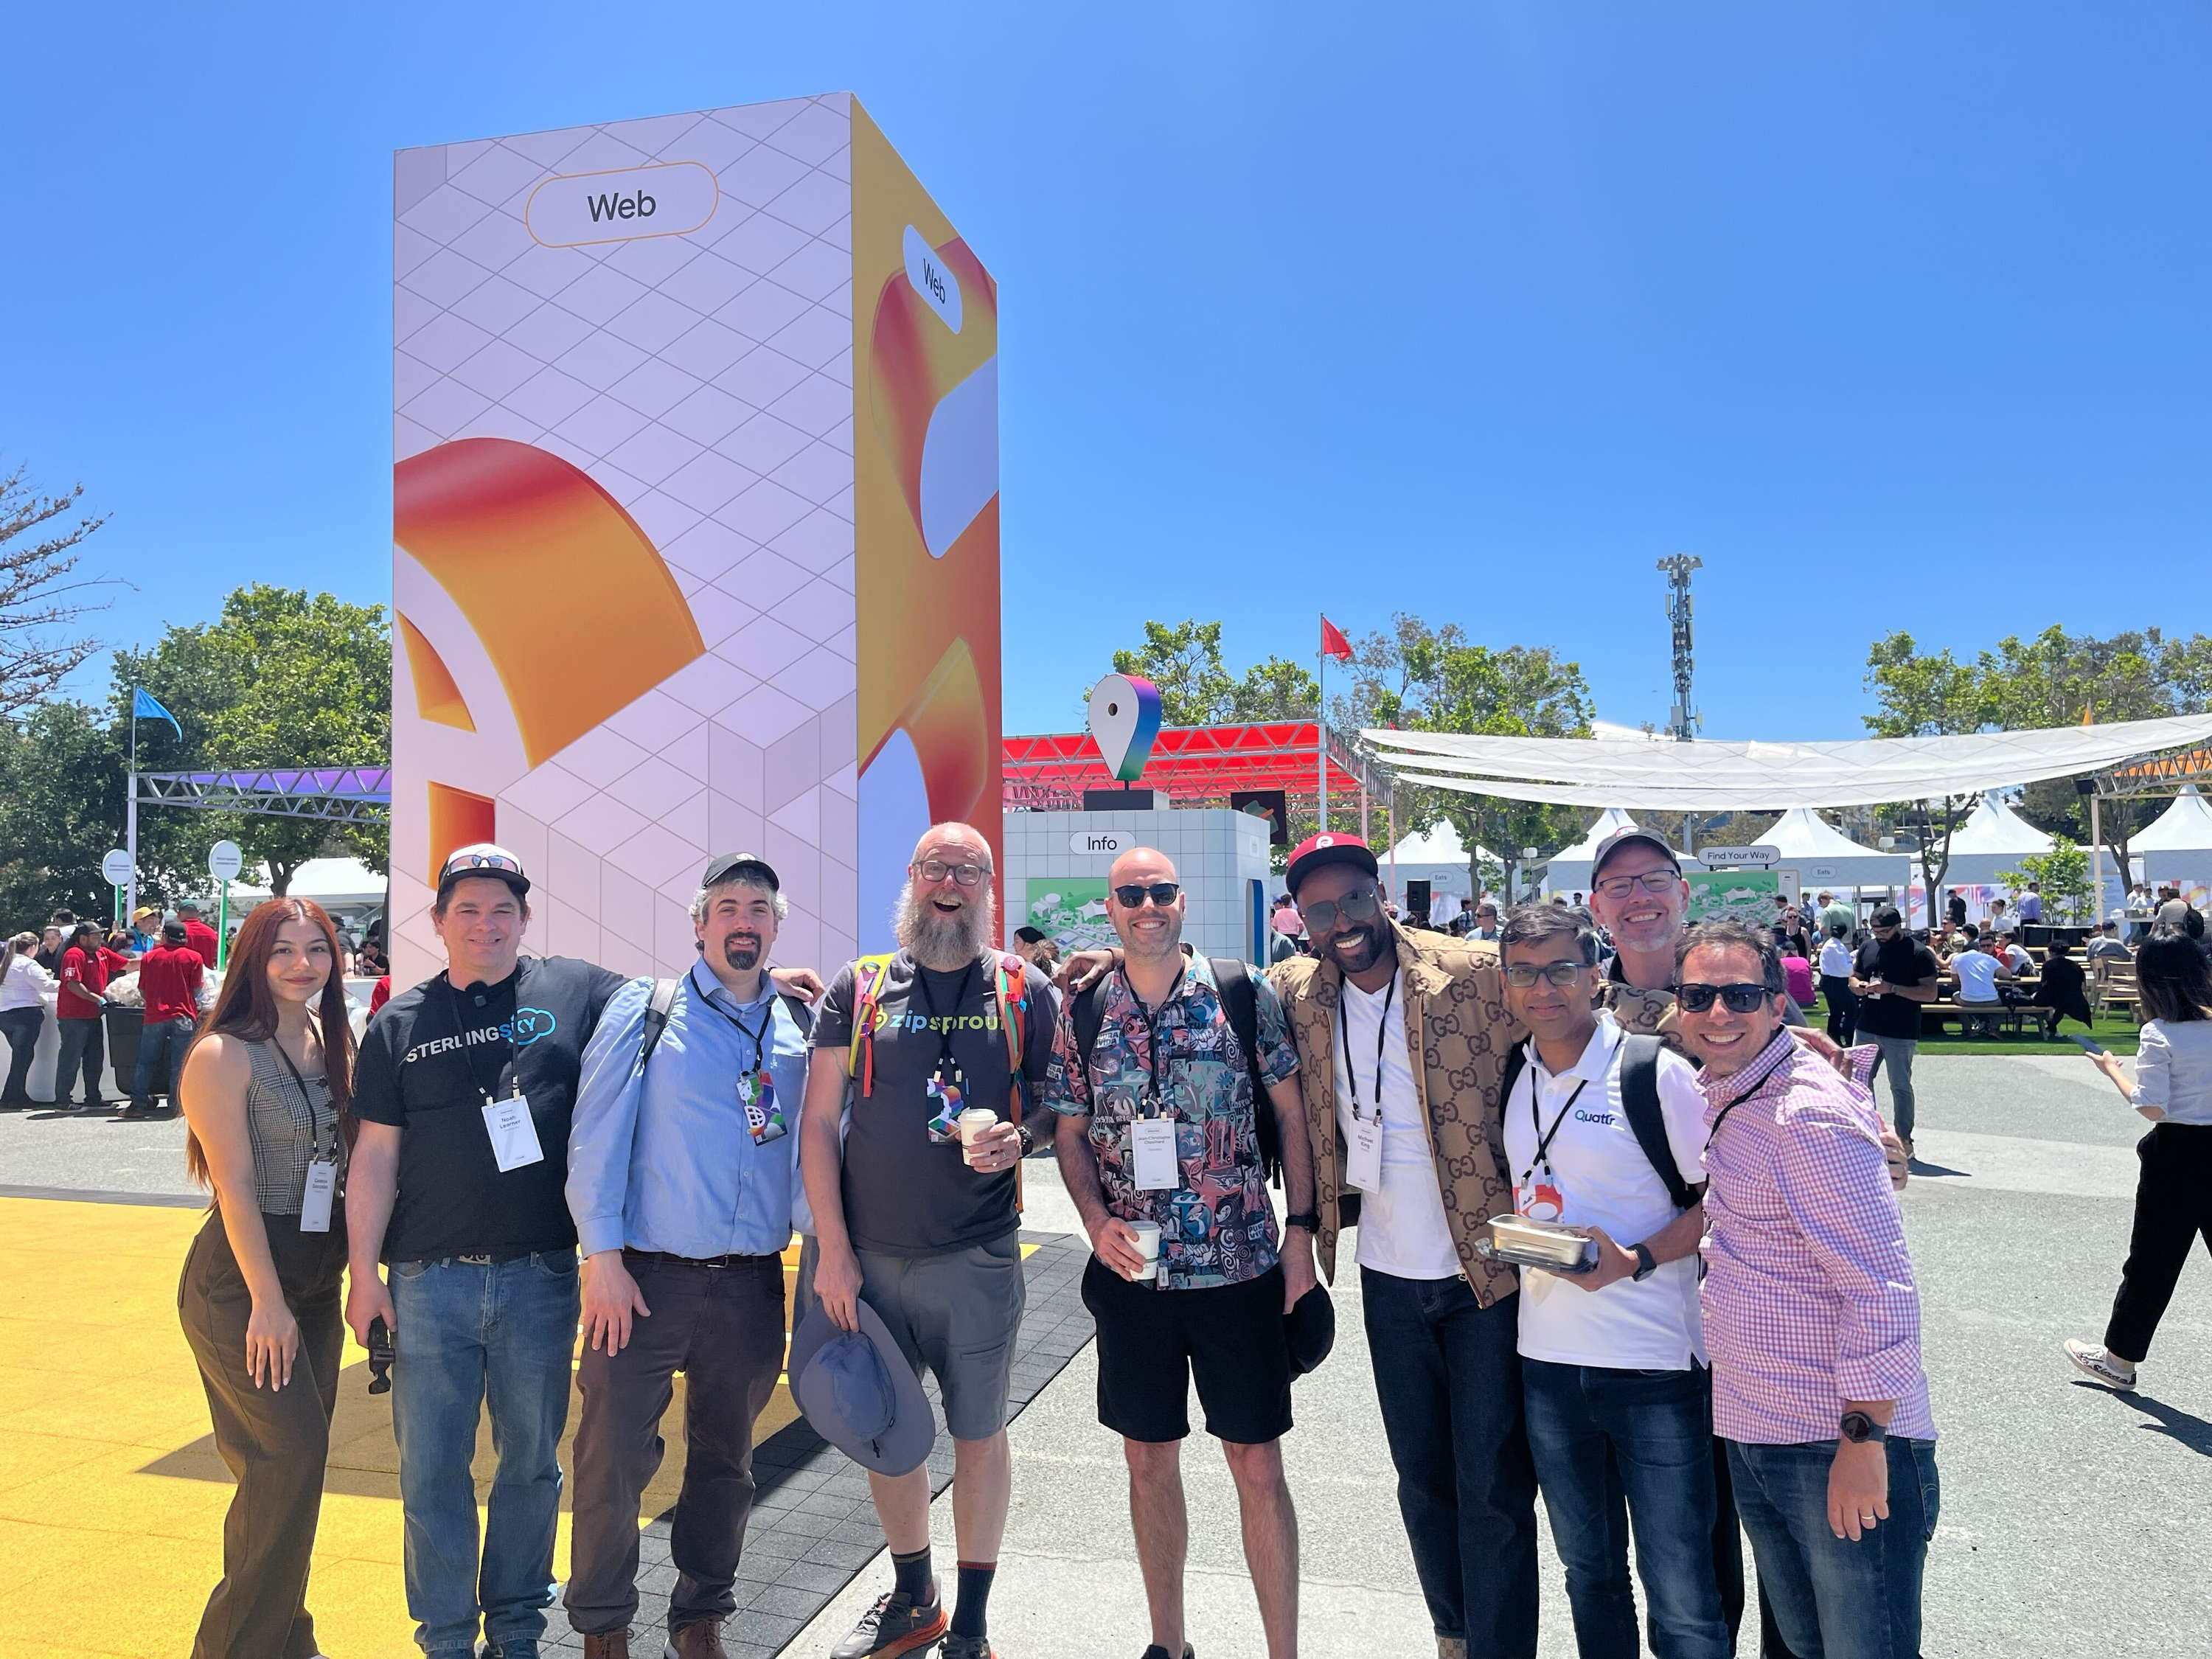
How Google I/O 2025 is Reshaping Search According to SEOs May 22nd, 2025 By Celeste Gonzalez Every year, Google I/O gives us a peek at what’s next. From AI-enhanced search to augmented reality experiences and new… READ MORE →
SEO Week 2025: SEO is Dead, Long Live SEO May 13th, 2025 By Caleb Cosper It wouldn’t be a dramatic blog post about SEO without ironically saying “SEO is dead”, right? The irony is certainly… READ MORE →
The Strategic SEO Approach That Outperforms Always Creating New Content May 8th, 2025 By Melissa Popp There's a quiet pressure in digital marketing that rarely gets questioned: the idea that if you're not constantly publishing something… READ MORE →